
Summary
This page of the user manual describes the tables used to record and interpret an archaeological excavation and explains how you can find details of the data held in the tables.
This is a relational database
The Anchurus II release 2 database is a relational database so data is held in tables. The tables hold their data in columns and rows. The tables are linked together with relationships. This structure of tables, table columns, table rows and inter-table relationships help to manage the integrity of the data from an excavation and during post excavation.
Users access these tables using the Anchurus II web application.
Organisations, Anchurus II systems and databases
Each organisation using Anchurus II does so through an Anchurus II system; a self-contained entity which runs on a server and is completely independent of any other Anchurus system. This system is owned by the organisation and is operationally their responsibility.
Each system has its own database which is completely separate to the databases associated with other systems,
Within their system, an organisation can record the archaeological fieldwork on many different sites. The organisation can assign one or more sites to a project but within Anchurus II each site is treated as a separate entity with its own site manager and group of workers. For more information about users see the user manual page 5 Anchurus II systems, users, roles and access permissions
Overview of the database
The figure below shows the overall structure of an Anchurus II database. There are four main groups of tables.
- The Archaeological base tables: shown in blue, are the tables that are used to record the site, anomalies and contexts
- The Finds tables: shown in green, are the tables used to record finds and used by find specialists to develop find reports
- The Stratigraphic Analysis tables: shown in orange: are used to interpret the evidence from the site
- The Data access tables: shown in pink, are used to write SQL queries to give users access to the data in the other tables
The next sections in this manual page summarise the data held in these tables.
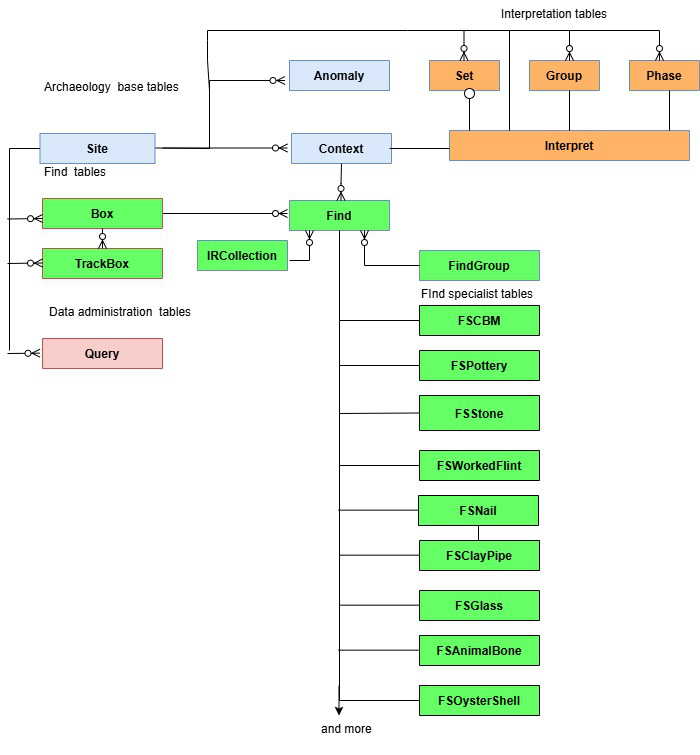
Figure 8.1. The Anchurus II database used to record and interpret an archaeological site
Archaeological base tables
These tables are:
Site table
A site is located at a single modern address with single ownership and reflects the permissions required for archaeological intervention. As an archaeological site, it is a discrete geo-located area of ground that is undergoing archaeological investigation and excavation.
Anomaly table
An anomaly is a two dimensional representation of human activity in a geophysics survey plot, a topological survey, a Lidar plot or a map of evidence. All the above can be geopositioned but in Anchurus II release 2, we record a textual record of the anomaly and its significance. so we can integrate this information in group with the other information to provide a fuller interpretation of the site.
Context table
A context is the smallest unit into which the archaeological record may be divided (Clarke et al. 2019: 15).
A context is recorded in terms of:
- Type: what is represents, one of: deposit, cut, fill, structure
- Name1: the name given by the diggers
- Description1: in terms of the soil colour etc and its inclusions, written by the diggers
- Interpretation: written by the diggers
- Name2: given by the interpreters. This is the name used in reports
- Description2: given by interpreters. This is the interpreter’s description.
Note: when the content is first recorded. Name1 and Name2 are the same and Description1 and Description2 are the same. Thereafter Name1 and Description 1 are frozen so as to preserve the digger’s words, the interpreters can change Name2 and Description2
Finds tables
A find is a term applied to all artefacts, building materials, industrial residues, environmental material, biological remains (including human remains) and decay products (Introduction, Chartered Institute for Archaeologists).
The find tables enable you to record, catalogue, file away and store finds and to present them to Find Specialists to help identify their production, life histories and use of site and thereby write comprehensive finds reports.
These tables are:
Find table
All finds are recorded in the find table. This table represents the minimum details needed to link finds to contexts, and the other Stratigraphic Analysis tables together with the details necessary to maintain a catalogue, and a filing and storage system that embraces all your finds.
See the user manual page 18 Recording finds for the use of this table.
Find Specialist tables
Experience has shown that most find specialists have their own way of recording finds in their area of interest; typically this is recorded in a spreadsheet. Anchurus II supports this by providing a service whereby the Find Specialists spreadsheet can be converted into a Find Specialist table. This then allows us to combine the information intheir table with the Stratigraphic Analysis data and hence into matrices and plans.
Figure 8.1 shows some of the Finds Specialist tables that were used to record the finds found at our Blounts Court excavation.
FindGroup table
For many years, pottery specialists have been identifying pottery groups, based on pottery fabrics and vessel forms etc. In parallel, in the IT industry, system architects have been using object oriented data analysis methods to analyse data. These two groups of people are doing the same task using different terminology.
In Anchurus II we recommend and teach users how to apply object oriented data analysis methods to most of the other find material types. The result of doing this is that for each material type we can identify findgroups.
A find group is a collection of finds that share characteristics which were established when finds in that group were produced. For example a group of pottery finds made of the same fabric or a group of worked flints dating to the Bronze Age. Ideally, a find specialist will have identified the specific characteristics of finds in a find group. You identify find groups because they are going to be described in a finds report. For example if for a particular material type such as pottery or peg tile, you identify 20 find groups, you would expect to have a finds report with at least 20 find group paragraphs, describing what you found and its significance to the site you are excavating.
The FindGroup table lists your find groups each with a name, description and, with luck, a production date range. Typically, each find in a find group will have a production date range inherited from the FindGroup but in some cases, a find has other features or marking which provide a spot date (a tighter date range). See user manual page 20 Dating Findgroups, finds, contexts, sets, groups and phases.
Interpretation tables
Set table
A set is a group of contexts found in a single excavation area. It represents the evidence of or remains of some human activity. A typical example of a set are a post hole recorded as a cut context and one or more fill contexts.
Note: in the Archaeologists Guide to Good Practice handbook (see user manual page 2) this concept is called a Subgroup a name which detracts from its archaeological significance. If you would prefer the word “Subgroup” to “Set “then this is done in the Anchurus II database definition.
Group table
A group is a group of sets, context and anomalies which identifies a structure and / or a distinct area on the site of human activity.
A Group record has a name, chosen to help anybody reading your archaeological report to understand what you found
Phase table
A phase represents a period of use of a site embracing a succession of groups representing structures and/or areas of human activity on the site over time.
A report of a site usually identifies several phases starting the earliest dates phase and progressing through time. This approach is taken because human activities in the early phases influence the latest phases.
Each phase record has associated with it: a name. a description, a rationale as to why the archaeologist highlighted this as a phase and the time period when the phase was in use. Recording the rationale for choosing a phase is important because the choice can be influenced by a variety of factors including, in no particular order:
- The Ownership of the site and changes of ownership over time
- The structures found on the site
- The finds found on the site
- The use made of the site
The phases are recorded in the database as fully as possible and then exported to form the basis of an archaeological report.
Interpretation table
This table records a series of interpretations that you make of a site which gives you a record of how your understanding of the site changed over time.
For each interpretation you record:
- Phases and within each phase the groups that existed during that phase
- Groups and within each group the sets, contexts and anomalies that contain the evidence confirming the existence and use of the group
- Sets and within each set the contexts that support it
This table is used to generate queries which link phases to contexts and it finds within that context or conversely to a find or collection of finds and shows the sets, groups and phases in which they were deposited.
Data access tables
The Query table
One of the challenges of providing an IT system to support archaeologists is that many of them have little or no interest in technology. The way forward is to work towards the position where everybody working on the project has an understanding of Figure 8.1 above and the data sets it represents and hence can explain the information that they want to access.
The workflow for creating a query involves the following steps:
- As an Anchurus II user, you write in a natural language and identify the tables you want to access
- The system administrator takes your request, translates it into a SQL statement (SQL is the language used to access the Anchurus II database) and runs it to retrieve data from the database and present it as a list
- You and the system administrator then review this together to confirm that it is producing the required results
- The system administrator completes the entry in the query table by adding guidelines to remind you how to use the query
The data held in tables and columns
Every table consists of columns and rows. The easiest way for you to learn what data is held in a table is to:
- List the table. Figure 8.2 shows the contents of the Context table. The table header reminds you of “What is a context”
- You then select a row and view it. Figure 8.3 shows the columns in the table with, for each column a reminder of its contents and the value for the chosen context
See user manual Using the Anchurus II web application for how to list a table and view a table row.
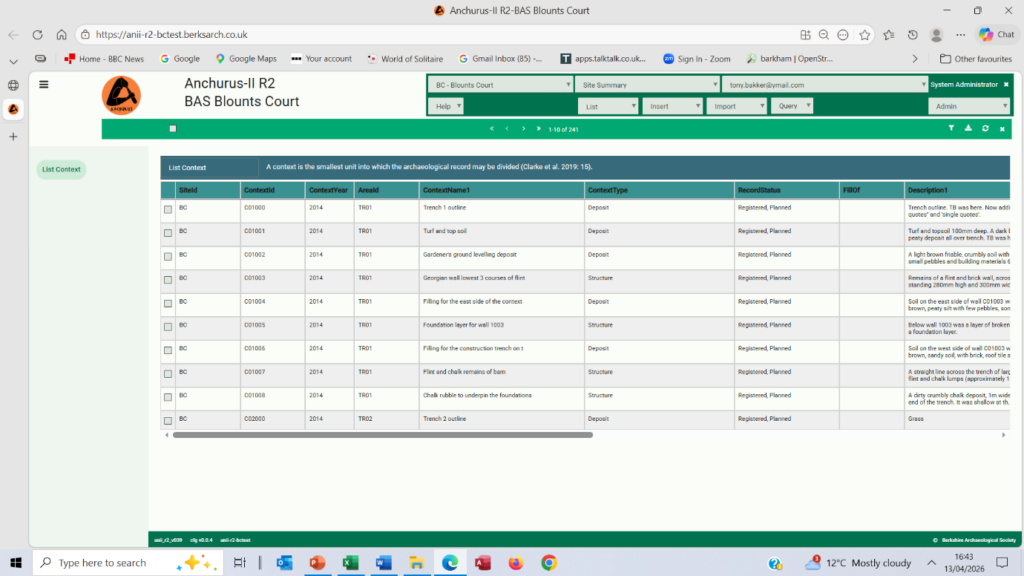
Figure 8.2 Screen shot of the Anchurus II web application showing the contents of the Context table 01001
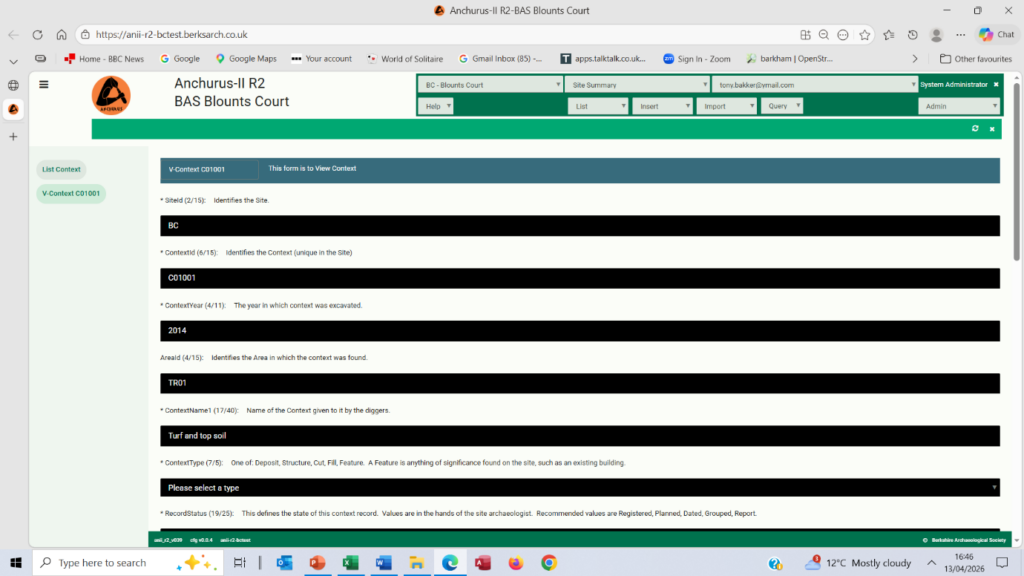
Figure 8.3. Screen shot of the Anchurus II web application showing the details of Context C01001
Andrew Hutt
Version v20a
14/4/2026