
Summary
This page explains the basic capabilities of the Anchurus II web application. It has been written on the basis that your site leader has given you site viewer access to the Anchurus II web application so you can review the data that has been created to record and interpret the archaeological site on which you have been working.
The database tables
As a viewer, you will be able to view all the tables in a database (see Figure 8.1) and run all the queries which have been created to produce archaeological reports for the site.
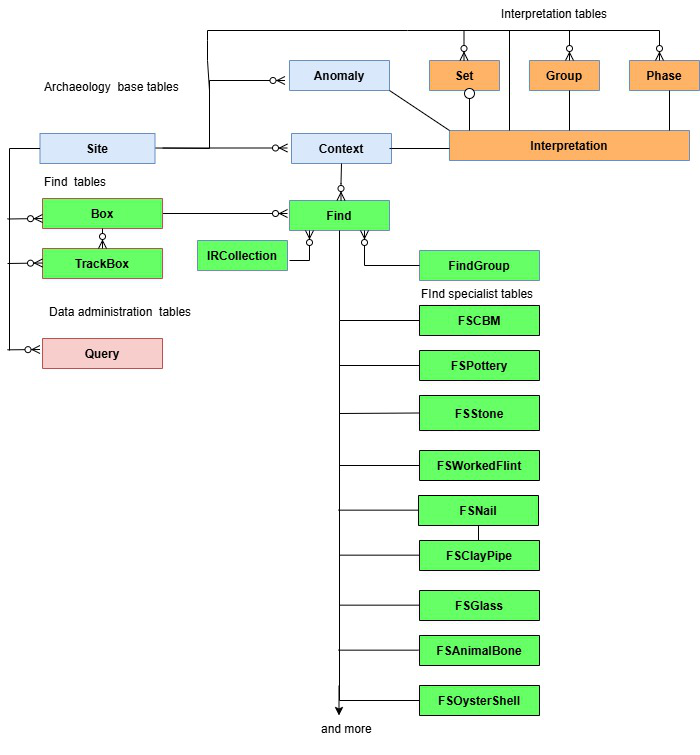
Figure 8.1. The database tables you can access as a site viewer
Getting started
To start using this application you will have been given the URL to access it.
You copy the URL into your browser and click on it. This will take you to the welcome screen (Figure 8.2) with details that confirm you have accessed the correct application and system. Alongside the Anchurus logo, you have the name of the application and the system that you are accessing. At the bottom of the screen there are version details of the web application.
Click on Login and you will be presented with a popup asking for your email address and password with the option of changing your password. For details of how to Change your password and Sign up, see user manual page Preparing to use Anchurus II.
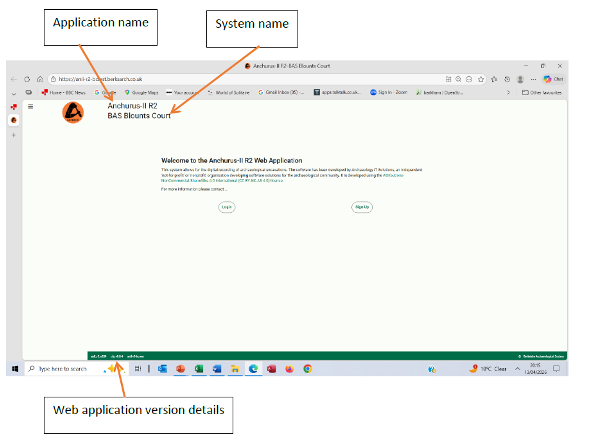
Figure 8.2 the welcome screen
The control screen
Once you have logged in, you will be presented with the control screen (Figure 8.3).
In the control screen heaader (the green box), you are presented with:
- A “Select site” dropdown which will give you a list of sites you can access
- Your email address
- Your status as a user (either System Administrator or Site User)
On the next line there is a Help dropdown that will take you to the Anchurus website.
Below the control screen header, the screen is divided in two parts. On the right hand side is the work area. In Figure 8.3 , the work area contains the “Introduction”. On the left hand side, once you have accessed a table, will be a list of work areas (Figure 8.5)
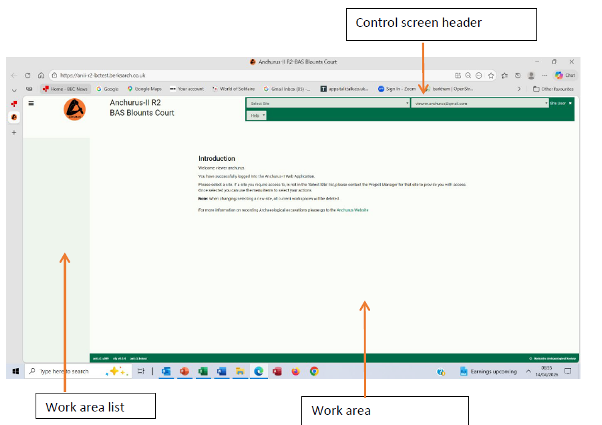
Figure 8.3. The Anchurus II control screen you see after you have logged in
Selecting a site
Click on the Select site dropdown and you will see a list of sites you can access. Select a site and you are presented with a revised control screen (Figure 8.4). The top line of the green box now has:
- Select site dropdown showing the selected site. It also allows you to change the site you are using
- Site summary: which, when you click on it, gives you, in alphabetical order, the tables you can access and the number of rows in each
- Your email address
- Your role when accessing this site
Below that are three dropdown menus:
- Help will take you to the Anchurus website and back to this manual
- List will take you to a drop down menu which a list of the tables (see above) that you can access
- Query will take you to a list of queries that you can access
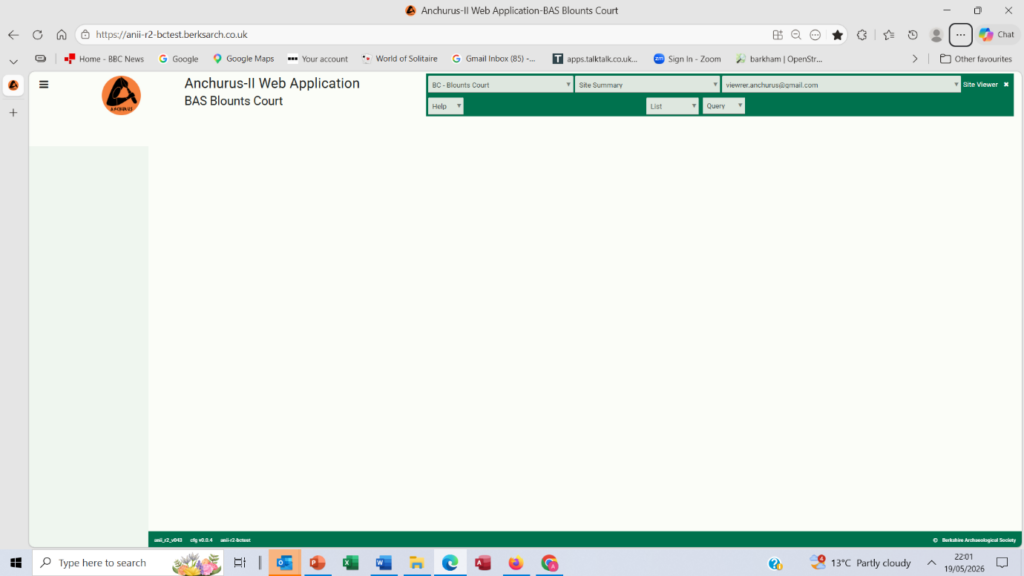
Figure 8.4. The site viewer’s control screen after you have selected a site
Viewing a table
If you select a table from the List dropdown you will be presented with a work area with the list of up to 10 table rows (Figure 8.5 shows a list of contexts).
The areas on this screen are:
- The control screen header: which you use to create work areas
- The work area header with a series of icons you use to control access to the table. For details of these icons see Figure 8.6
- The work area: with the table name and description followed by the column headings and up to 10 table rows on a page. Within the table row, text fields are presented with up to 2 rows of text. If the text ends with “…” then the database contains more information. You can view this by hovering your mouse over the text field.
- Below the last row is a horizontal slider which allows you to scroll to see all the columns in the table.
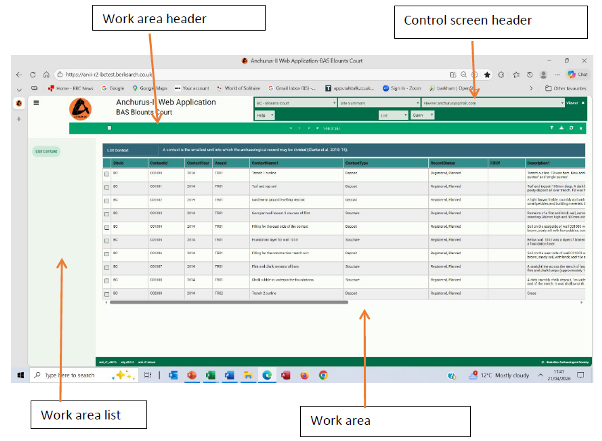
Figure 8.5. A table list from the context table
Figure 8.6 shows all the icons used in the web application and an explanation.

Figure 8.6. The icons used in the work area header
The icons will appear following your actions and will also depend on your access privileges.
Filtering columns
Once you have a table list, you can filter the columns by clicking on the filter columns icon. You are presented with a popup with a list of columns in the order they are held in the database. When this popup is first presented all the green boxes on the left hand side of a column name are selected/ticked. Clicking on a ticked green box or the column name will select or deselect the column. When you scroll to the bottom of the list and click Submit, only the selected columns are displayed.
Note: You can use the vertical slider on the right hand edge of the ‘filter columns’ popup screen to scroll the popup and hence reach the Submit button.
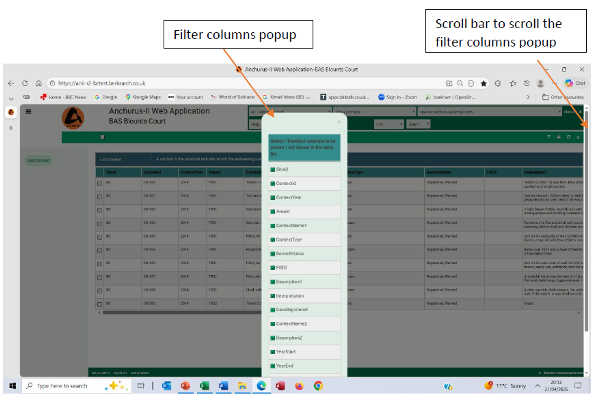
Figure 8.7 The filtering columns popup
Viewing a table row
Each table row is preceded with a checkbox icon. If you click on it to select a row, a view icon appears in the work area header . This allows you view the table row in a new work area. If you click on this icon a new work area is created with the column details from the table row you selected (Figure 8.7).
For each table column, you are presented with the column details:
- A “*” indicates that this column value is required
- The column name
- The column format in brackets
- A description of the column
This is followed by the contents of the column. The black background shows that you cannot change it. When you hover the mouse over the field you will see the Ban icon indicating that this field cannot not be changed.
The righthand scroll bar allows you to access all the columns in the table.
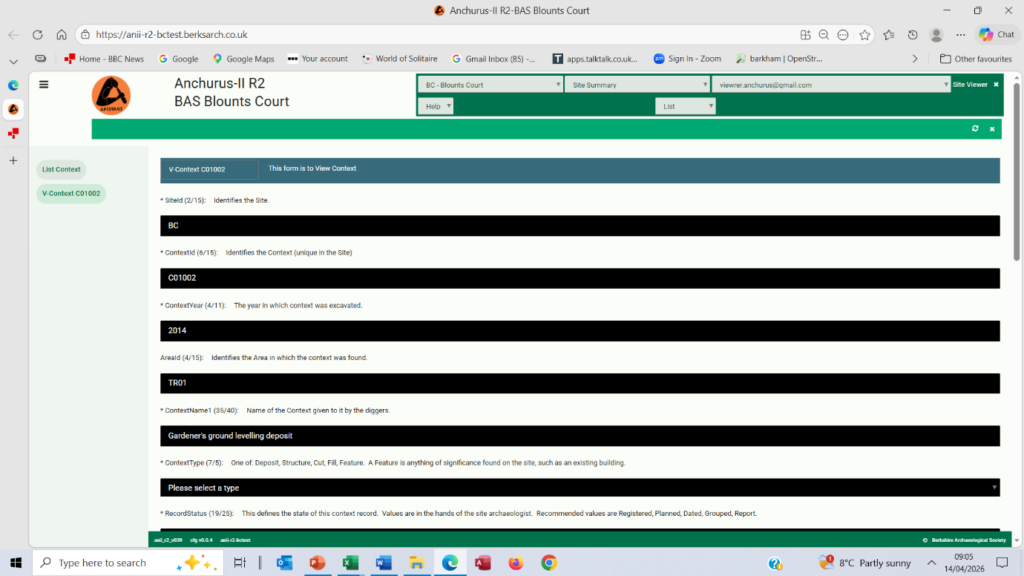
Figure 8.7. A table row showing the columns
Running queries
As you work with the tables you may want more precise presentations of the data. You can do this by running queries; these are SQL select statements that can:
- Select and reorder the columns in a single table
- Join tables together by using the relationships shown in Figure 8.1
- Select rows based on the values in the columns
- Order the rows based on the values in the columns
Typical examples of such queries are:
- List all the pottery finds with details of the context in which they were found
- List all the finds in a specific context
- Find all the contexts dug in a specific year in excavation order and within that context order
The queries are listed in a query table, which you can view as for any other table. Figure 8.8 shows that this table records:
- The query name: chosen so that you can discuss it
- The operation of the query: as a viewer you only have access to queries that list data
- The tables accessed using the query: these tables are listed in Figure 8.1. If the query accesses columns from more than one table they are listed here
- What it does: written in English that everyone can understand
- How to use it: explains how to use the query. Most queries you just call.
- SQL : records the programme written in the SQL (Structured Query Language) used to access relational databases
The above details are important because if you want a new query you need to express your requirement using items 1 to 5 above, and then discuss it with your site leader who can write new queries in SQL.
When you list queries, the work area header includes the Run query icon. To run a query first select the query by clicking on the row checkbox icon and then click on the Run query icon. The results are shown a new work area (Figure 8.9).
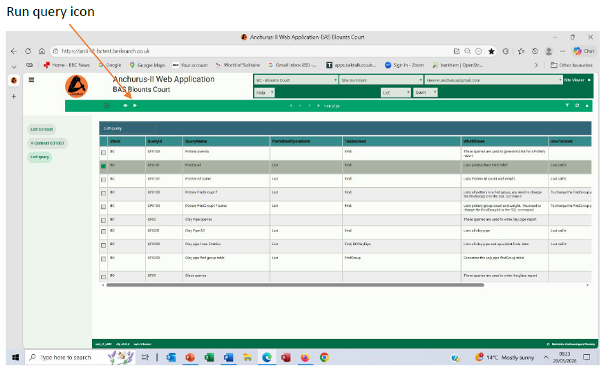
Figure 8.8. A query table list showing a selected query and the Run query icon
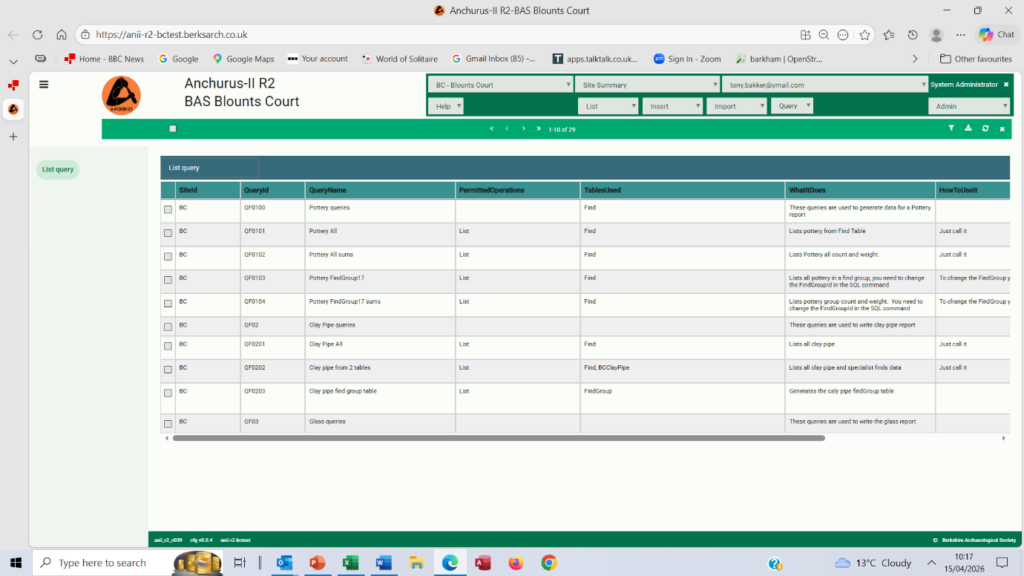
Figure 8.9: The results of running the Pottery All query
Saving your work areas
You can save your work areas by clicking on your email dropdown menu and selecting ‘Save work areas’.
When you next login, your saved work areas will be reinstated and presented in your work area list.
Anytime you click the ‘Save work areas’ option, the existing saved work areas will be overwritten with the current work areas.
There is also an option to ‘Clear work areas. This will remove the saved work areas. The next time you login, the active work area list will be empty.
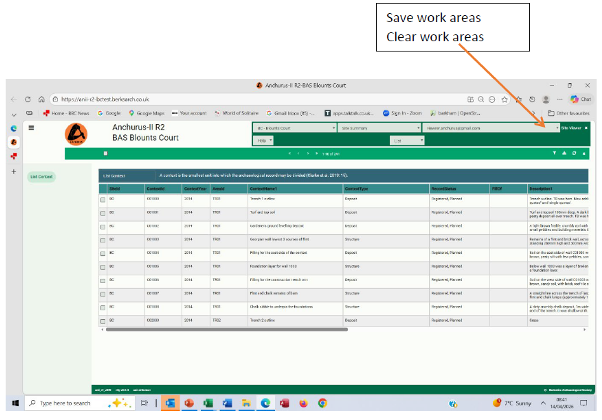
Figure 8.10. Saving and clearing your work areas
Closing a work area
To close a work area you click on the right hand icon in the control screen header.
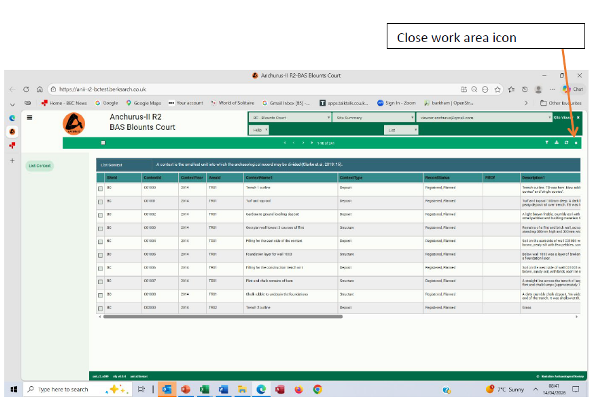
Figure 8.11. Closing a work area
Logging out
To log out of the Anchurus II web application you click on the logout icon, which is located next to your role at the top right of the browser window.
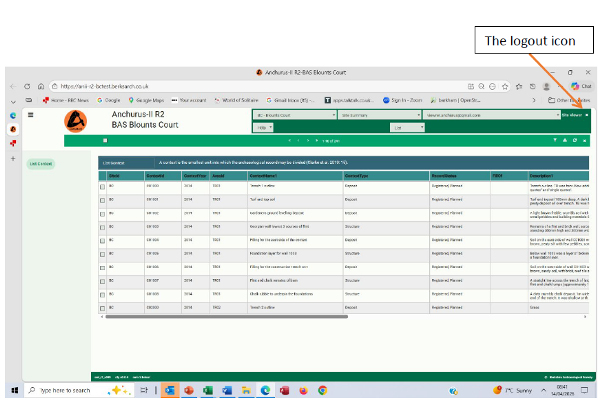
Figure 8.12. Logging out
Andrew Hutt and Tony Bakker
Version v08
24/05/2026